Moorfields Acuity Chart Set


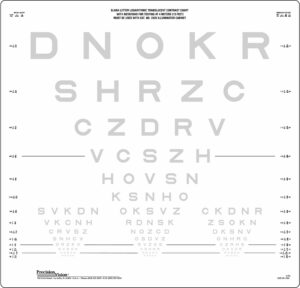
The Moorfields Acuity Chart (MAC) test includes two different letter charts (MAC 1 for the right eye and MAC 2 for the left eye). They are constructed using high-pass filtered letter targets. These letters are composed of a black core with surrounding white borders and are presented on a grey background.
$575.00
Description
The Moorfields Acuity Chart (MAC) test includes two different letter charts (MAC 1 for the right eye and MAC 2 for the left eye). They are constructed using high-pass filtered letter targets. These letters are composed of a black core with surrounding white borders and are presented on a grey background.
The mean luminance of the letter target is similar to that of the background resulting in very similar detection and recognition thresholds. This leads to the appearance of the letters vanishing close to threshold, hence their description as ‘vanishing optotypes’. This holds true for individuals with no ocular abnormalities viewing centrally using the fovea.
Intended Use
These test targets have been shown to be more equally discriminable and have shown lower measurement variability compared to conventional letter designs. They have also demonstrated a superiority in detecting deficits in visual function in age-related macular degeneration when conventional letter acuity remains normal. More data is needed to evaluate their performance in the presence of other ocular abnormalities and it is anticipated that the MAC will be incorporated into world-wide research protocols to investigate this comprehensively. CE marking is currently being undertaken.
The charts are constructed based on the gold standard design of the Early Treatment Diabetic Retinopathy Study (ETDRS) charts. These employ a logarithmic progression in letter size allowing for single letter scoring, in which each letter read correctly is incorporated into the final calculated acuity score. This has demonstrated more accurate and precise visual acuity measurements with lower test retest variability compared to conventional line scoring using Snellen chart designs.