March 15, 2022
 Articles
 Newsletters
 Videos
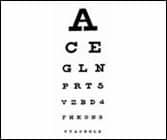
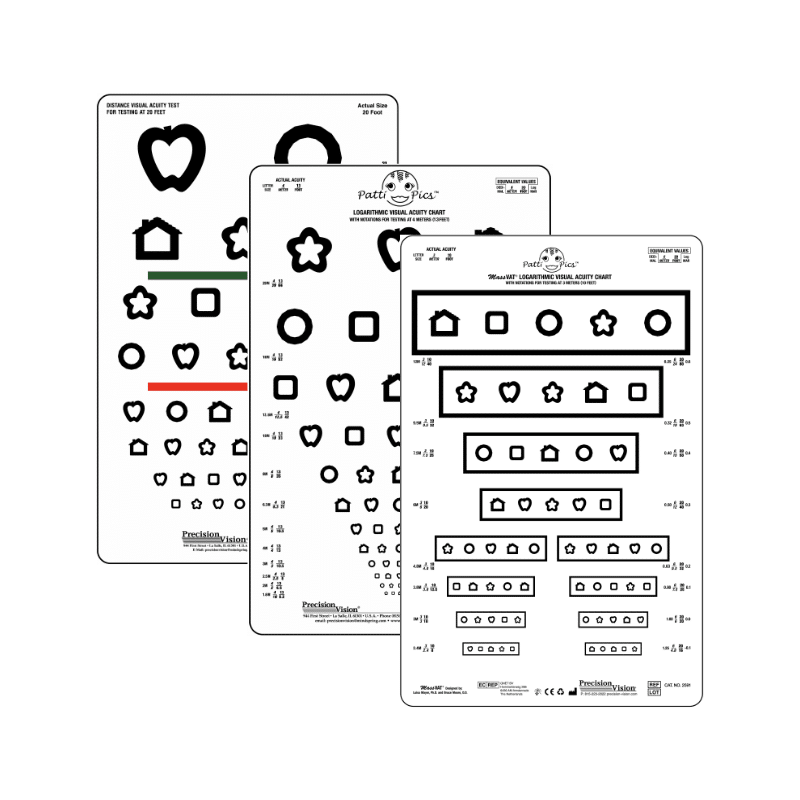
Snellen designed his optotypes on a 5×5 grid, on which the line thickness is one unit and the letter width and height are five units. This system is followed for most letter and number charts. For children’s tests (such as Allen pictures and other test symbols), it is often abandoned and much thinner lines are used. Precision Vision offers stylized pictures, called Patti Pics, for which Snellen’s 5×5 principle is followed. They result in less change in the measured acuity when children graduate from picture charts to letter charts. Alternative symbols that can be used for illiterate adults or in countries that are not familiar with the Roman alphabet are the tumbling E test and the Landolt C or broken ring.
Letter charts are not only used to measure visual acuity, they are also used as targets for subjective refraction. This is the main reason distance acuity is measured more often than near acuity. At a long distance, accommodation is relaxed, so that the refraction can be more accurate. At a longer test distance, the effect of small changes in the subject’s position is less important and can be ignored.
As today’s exam lanes often are smaller than 20 feet (6 meters), charts are often designed for shorter distances. This is no problem for visual acuity measurement, as long as the actual test distance is accurately accounted for. For use in refraction, shorter distances are less desirable. At 4 m (the recommended distance for ETDRS charts) the accommodative demand is 0.25 Diopters and cannot be ignored. In smaller rooms, the use of mirrors is recommended to increase the test distance.
Letter size
Snellen used a rather verbose definition to indicate the letter size: “the distance in meters (feet) at which the letter subtends 5 min of arc.” Louise Sloan simplified this by defining the M-unit as the size that subtends 5 min of arc at 1 meter. Thus, the verbose statement “this letter subtends 5 min of arc at ‘x’ meter” can be simplified to “this letter is ‘x’ M-units”. Here the number denoting the M unit size is the viewing distance in meters for 20/20 acuity.
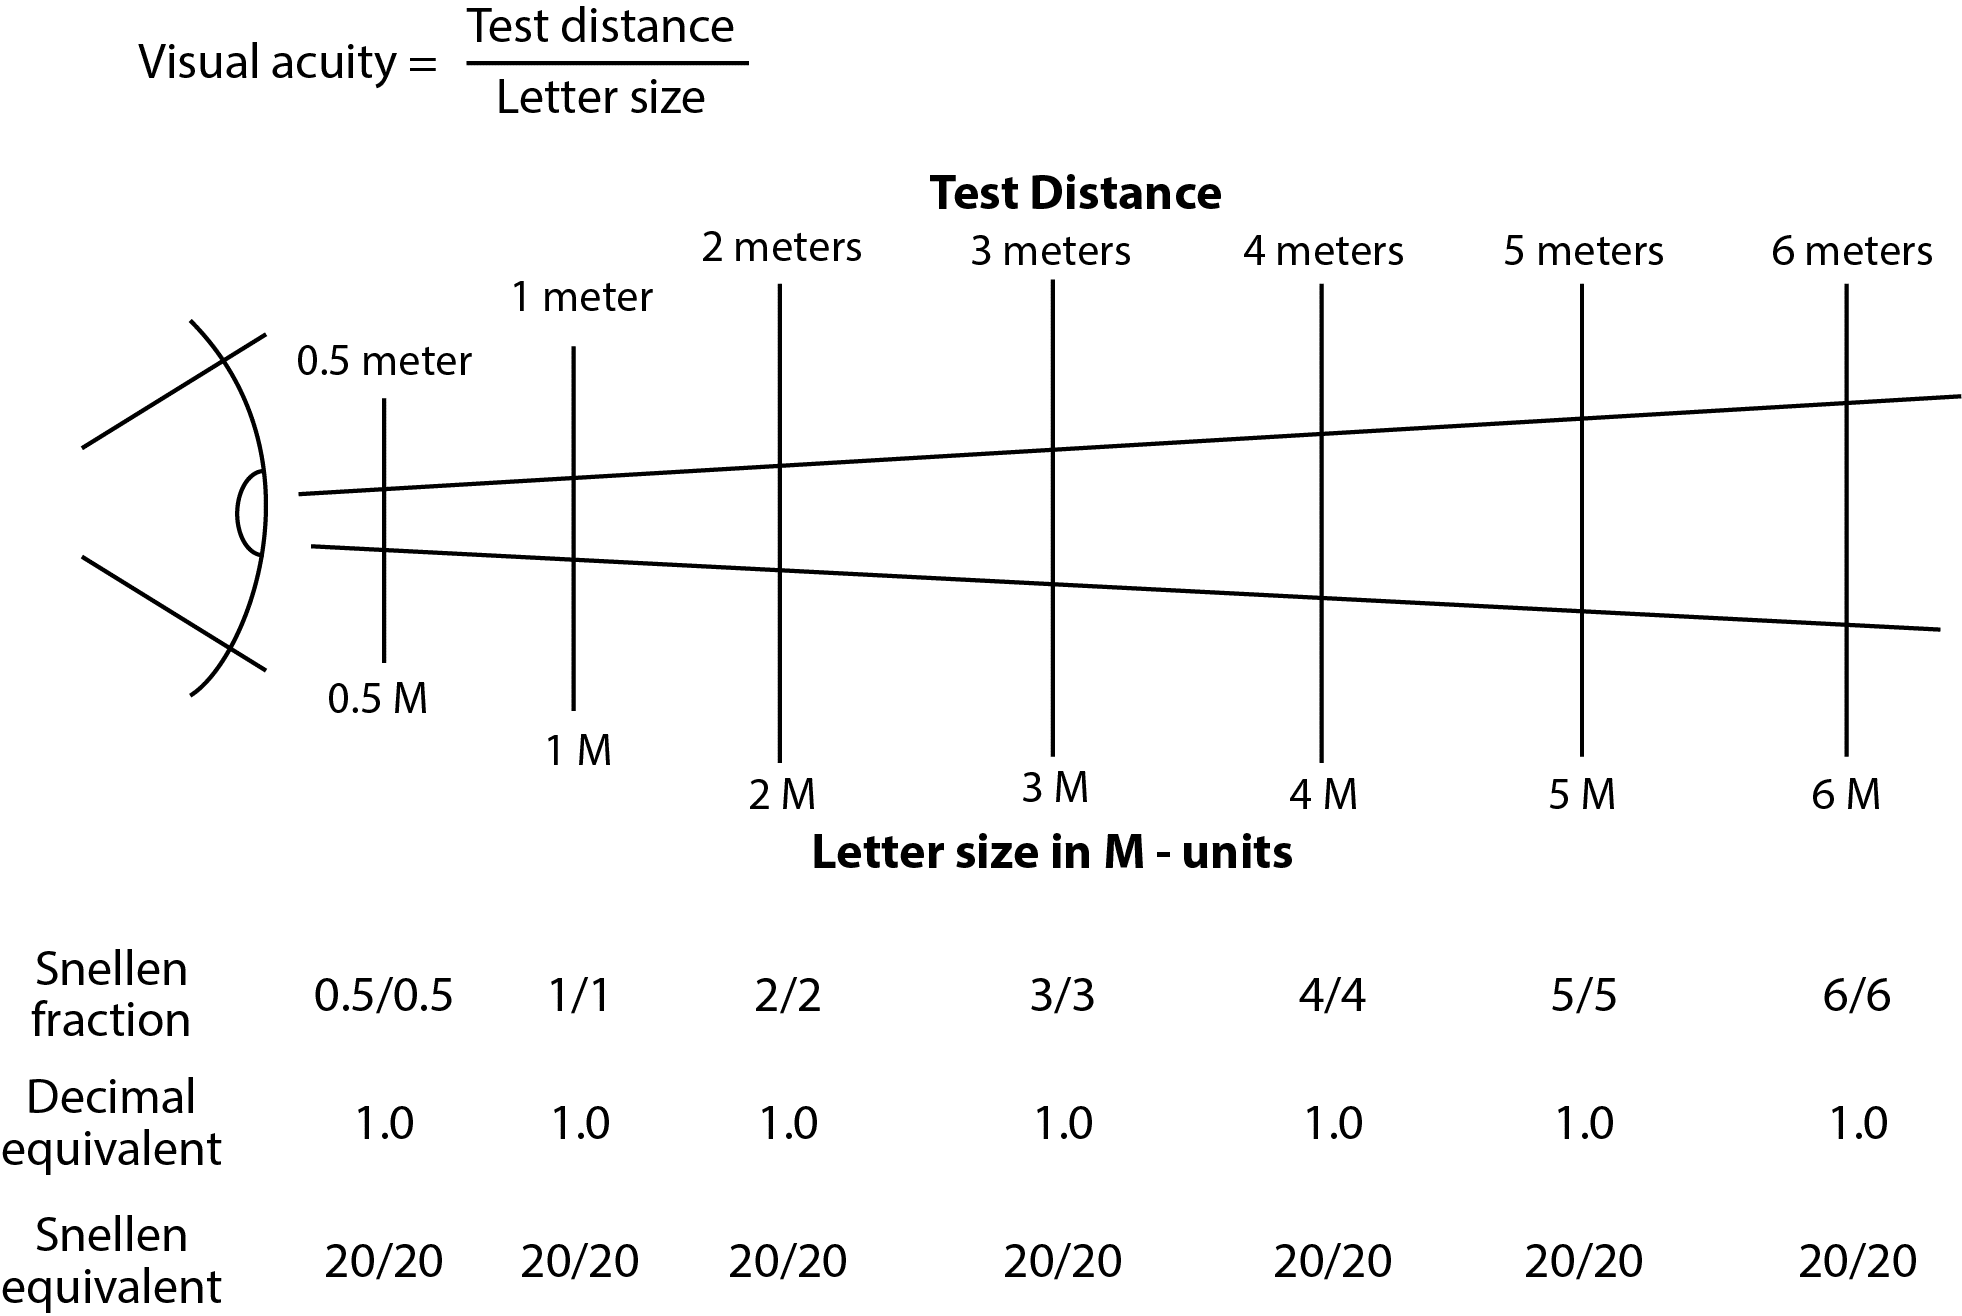
Most Precision Vision eye charts carry the letter size designation in M-units. This makes it easy to calculate the visual acuity if the chart is used at any other distance than the one for which it was designed by inserting the new test distance (in meters) and the letter size (in M-units) directly into the above formula.
Interpretation
It is a persistent urban legend that 20/20 would represent normal, average or even perfect vision. This is not so. Snellen deliberately chose his reference standard (5 min of arc) as a size that is “easily recognized by normal eyes.” Thus, almost all normal eyes will equal or exceed the reference standard. If 20/20 equaled average acuity, half of the population would fall short of 20/20, since that is the definition of average.
Visual acuity values are understood best by the following simple rule. On a Snellen chart we determine the line that the person can just recognize. If that line is twice as large as the reference standard (20/20), we state that that person’s MAgnification Requirement (MAR) is 2x. If the MAgnification Requirement is 2x, the visual acuity is 1/2 (20/40). Similarly, if the MAgnification Requirement (MAR) is 5x, the visual acuity is 1/5 (20/100); if MAR = 10, visual acuity = 1/10 (20/200), and so on.
The MAR and the visual acuity scale are opposites. A high MAR value indicates low or poor visual acuity; a low MAR value indicates good acuity. Their relationship is also true in reverse. A patient with 20/60 (1/3) visual acuity needs 3x magnification to reach the reference standard. This can be achieved with large print that is 3x normal, with a 3x magnifier or with a 3x telescope. Since normal vision is better than 20/20, some extra magnification is desirable for comfortable and sustainable performance.
LogMAR Notation
The MAR value is best known for its logarithm: logMAR. As for MAR, a higher logMAR value indicates poorer vision. Although the logMAR notation is often presented as a visual acuity notation, it actually is a notation of vision loss. Zero logMAR indicates standard vision; zero visual acuity indicates blindness.
The logMAR notation is most convenient when used with a chart where the letter sizes follow a logarithmic progression, as on the ETDRS charts. Because of this, such charts are often referred to as logMAR charts. On these charts each increase of 0.1 units on the logMAR scale indicates a one line loss on the visual acuity chart.
The logMAR scale is widely used in scientific publications where visual acuity values need to be depicted graphically to analyze trends or need to be averaged across population groups.
Visual Ability
Persons with 20/40 (0.5) visual acuity need 2x magnification. This does not mean, however, that they have lost 50% of their visual abilities. Clinicians have long used the expression “lines gained” or lines lost” to indicate changes in visual ability. The Visual Acuity Score (VAS) provides a convenient scale to estimate visual abilities. On this scale 20/20 is rated as 100; on charts with a logarithmic progression each line is worth 5 points and each letter read is 1 point. 50 VAS points stand for 20/200; it is reasonable to estimate that at this level the average person has lost 50% of visual ability. Zero is reached for 20/2000, a level at which it is difficult to speak about visual acuity, since 100x magnification is needed for detail recognition.
In the AMA Guides to the Evaluation of Permanent Impairment (5th and 6th edition) the VAS scale is used in the calculation of visual disability. A study has shown that the AMA calculations provide better ability estimates than scales that were used previously.
Logarithmic Progression
The above discussion already indicated why a logarithmic progression of letter sizes is desirable and leads to more consistent measurements. The following table compares the characteristics of ETDRS-type charts with previous charts with an irregular progression. Although the name “Snellen chart” should apply to any letter- or symbol-based chart, some authors use the term Snellen chart only for charts with a non-logarithmic progression.
| Traditional charts | ETDRS type charts |
| The line-to-line steps are irregular, ranging from 14% (20/70 to 20/80) to 100% (20/100 to 20/200 to 20/400) | All line-to-line steps are equal 10√10, which is about a 4:5 ratio. |
| The number of letters per line varies. Thus the effect of missing one letter varies. | All lines have five letters. The effect of missing one letter is the same for all lines. |
| The spacing of letters and lines is dictated by the available space. Crowded letters are more difficult to recognize than widely spaced ones. | The letter-to-letter and line-to-line spacing is equal to the letter size. The relative crowding effect is the same for all lines. |
| Some letters are easier to recognize than others. This may result in easier and more difficult lines. | The difficulty of the letters used is taken into account. The average difficulty on each line is balanced. |
| Usually, only a single chart is used. This may lead to (voluntary or involuntary) memorization. | The ETDRS set consists of three charts to avoid memorization. |
| The shape of the chart is rectangular. | The shape is an inverted triangle. |
The evolution of letter charts from Snellen’s original chart to the ETDRS chart, which is considered today’s gold standard, has been discussed further on our Web site. Practitioners and researchers from all parts of the world turn to Precision Vision for “ETDRS” charts and other high-quality vision testing tools.
The following table compares different visual acuity notations.
| US notation | 6 meter notation | Decimal notation | MAR | logMAR | VAS |
| 20/10 | 6/3 | 2.0 | 0.5 | -0.3 | 115 |
| 20/12.5 | 6/3.8 | 1.6 | 0.63 | -0.2 | 110 |
| 20/16 | 6/4.8 | 1.25 | 0.8 | -0.1 | 105 |
| 20/20 | 6/6 | 1.0 | 1.0 | 0.0 | 100 |
| 20/25 | 6/7.5 | 0.8 | 1.25 | 0.1 | 95 |
| 20/32 | 6/9.5 | 0.63 | 1.6 | 0.2 | 90 |
| 20/40 | 6/12 | 0.50 | 2.0 | 0.3 | 85 |
| 20/50 | 6/15 | 0.40 | 2.5 | 0.4 | 80 |
| 20/63 | 6/18 | 0.32 | 3.2 | 0.5 | 75 |
| 20/80 | 6/24 | 0.25 | 4.0 | 0.6 | 70 |
| 20/100 | 6/30 | 0.20 | 5.0 | 0.7 | 65 |
| 20/125 | 6/38 | 0.16 | 6.3 | 0.8 | 60 |
| 20/160 | 6/48 | 0.125 | 8.0 | 0.9 | 55 |
| 20/200 | 6/60 | 0.10 | 10.0 | 1.0 | 50 |
| 20/250 | 6/75 | 0.08 | 12.5 | 1.1 | 45 |
| 20/320 | 6/95 | 0.06 | 16 | 1.2 | 40 |
| 20/400 | 6/120 | 0.05 | 20 | 1.3 | 35 |
| 20/500 | 6/150 | 0.04 | 25 | 1.4 | 30 |